Beyond Basic RFM: Introducing RFM-T-U-E(BDP) for Deeper SaaS Tenant Insights

Understanding your customers, or tenants in the SaaS world, is crucial. How engaged are they? Are they getting value? Are they at risk of churning?
For decades, businesses have turned to the RFM (Recency, Frequency, Monetary) model for feature engineering, especially in retail and e-commerce, to answer similar questions.
But here's the catch: SaaS isn't traditional retail. Applying classic RFM directly to the rich, continuous stream of daily usage data from SaaS tenants often leads to misleading or incomplete insights. It's time for an upgrade, we needed a better way to understand tenant health and engagement from our daily activity logs. That led us to develop RFM-T-U-E(BDP), an extended framework designed specifically for the nuances of SaaS.
The SaaS Challenge: Why RFM Falls Short
Before diving into the solution, let's pinpoint why the old model often doesn't fit SaaS data well:
- Recency is Ambiguous: Was the tenant "active" yesterday because thousands of users were heavily using the platform, or because a single automated sync ran? Classic RFM can't easily tell the difference. Low recency doesn't always mean high engagement.
- Frequency is Simplistic: Counting "active days" treats a day with one minor action the same as a day with intense, platform-wide usage. It misses the intensity and consistency vital to SaaS engagement.
- Monetary Value is Indirect: Daily logs rarely contain clean, direct transactional data. Relying on potentially incomplete
balancefields or simple usage sums can be inaccurate. We need smarter proxies. - Tenants Aren't Single Customers: SaaS tenants can have in some cases many underlying users. Tenant health depends on the breadth and depth of user adoption within the organization, something classic RFM ignores.
- It's Static: RFM provides a snapshot. It misses the rhythm and pattern of usage. Is a tenant consistently active daily, or do they use the service in irregular bursts? This dynamic view is crucial for understanding ingrained habits versus potential disengagement.
RFM-T-U-E(BDP): A Framework Built for SaaS
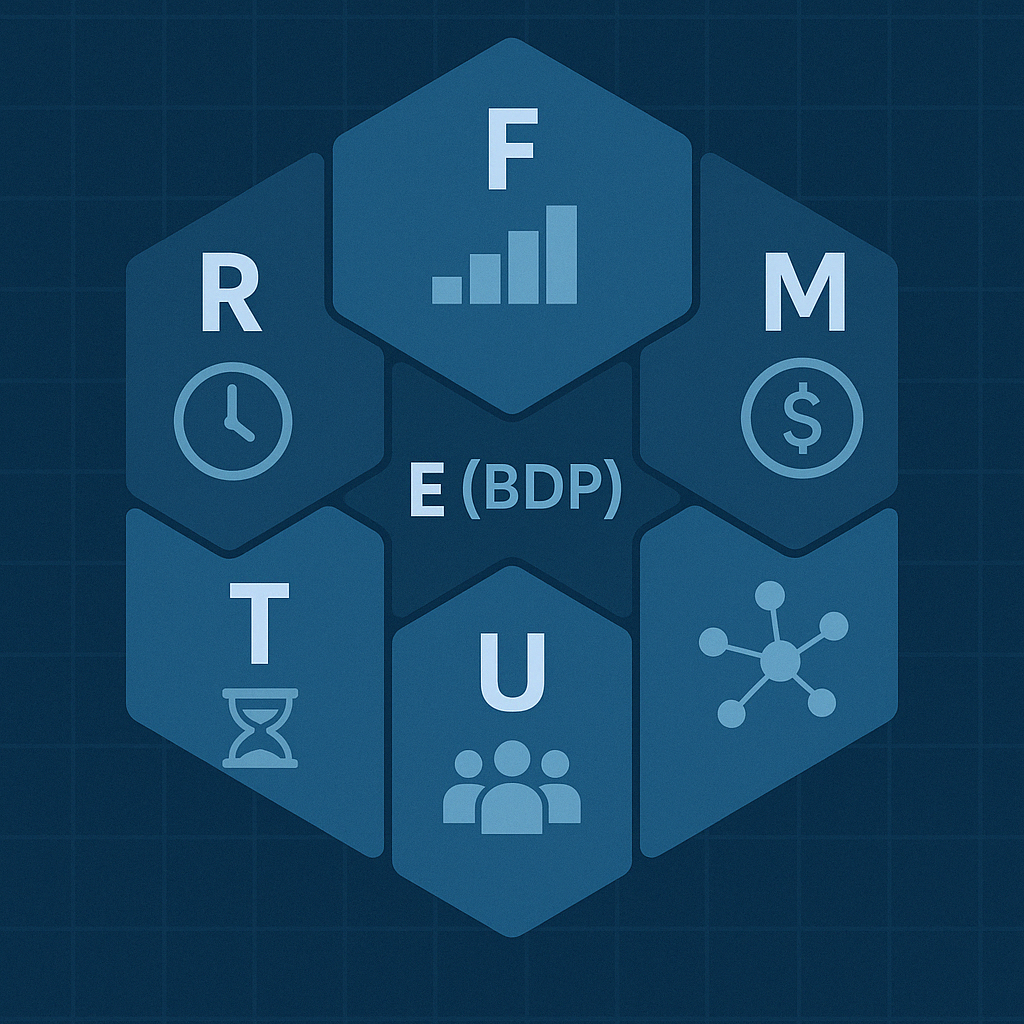
To get a truly holistic view, we needed more dimensions and smarter definitions. Our RFM-T-U-E(BDP) framework stands for:
Recency | Frequency | Monetary Proxy | Tenure | User Activity | Engagement (Breadth, Depth, Pattern)
Let's break down what each component brings to the table:
R: Recency
- Key Metric:
R_RecencyDays - What it measures: Days since the tenant's last significant activity.
- Why it's better: We define "significant" based on meaningful actions (e.g., exceeding call/usage thresholds, making a recharge). This filters out background noise and tells us when the tenant last truly engaged.
F: Frequency
- Key Metrics:
F_SigDays,F_AvgVolume_Recent - What it measures: The count of significant activity days (
F_SigDays) and the average intensity of recent usage (F_AvgVolume_Recent). - Why it's better: We measure both the consistency of meaningful interactions and the actual level of recent activity, providing a much richer picture than just counting logins or total active days.
M: Monetary Proxy
- Key Metrics:
M_TotalVolume,M_RechargeCount - What it measures: A weighted sum of valuable actions over the tenant's history (
M_TotalVolume) and the simple count of recharges (M_RechargeCount). - Why it's better: Creates a smarter proxy for lifetime value by assigning different weights to actions (e.g., core feature usage > basic usage, recharges weighted higher). Addresses incomplete direct monetary data.
T: Tenure
- Key Metric:
T_TenureDays - What it measures: How long the tenant has been a customer (days since creation).
- Why it's needed: Adds vital context. New tenants behave differently from established ones. Tenure is often a key factor in loyalty and churn analysis. (Requires tenant creation date info).
U: User Activity
- Key Metrics:
U_AvgActiveUsers_Recent,U_MaxActiveUsers_Recent - What it measures: The average and maximum number of daily active users/seats within the tenant over a recent period.
- Why it's needed: Directly addresses the multi-user reality of SaaS. Measures the scale of adoption and daily user base engagement within the tenant's organization. (Requires a reliable daily user count metric).
E: Engagement (Multi-faceted: Breadth, Depth, Pattern)
This is where we significantly extend beyond RFM, looking at how tenants engage:
E(B): Breadth - Feature Diversity
- Key Metrics:
E_DistinctFeatureCategoriesUsed_Recent,E_AvgBreadthPerActiveDay_Recent - What it measures: How many different parts of your platform the tenant uses recently.
- Why it's important: Tenants using a wider range of features are typically more integrated, find more value, and are often "stickier."
E(D): Depth - Core Feature Intensity
- Key Metric:
E_AvgDepth_[Feature]_Recent - What it measures: How intensely tenants use specific core features (e.g., average minutes per active day for that feature) recently.
- Why it's important: High usage depth on key features indicates reliance and power usage, complementing the breadth measure.
E(P): Pattern - Usage Dynamics (via Spectral Analysis)
- Key Metrics:
EP_Power,EP_PeakPeriod,EP_Entropy - What it measures: The underlying rhythm and regularity of tenant activity using techniques like Wavelet Transforms on their primary usage signal (e.g., daily minutes).
EP_Power: The overall energy/magnitude of usage fluctuations.EP_PeakPeriod: The dominant cycle length (e.g., daily, weekly patterns).EP_Entropy: How predictable vs. random the pattern is (lower = more regular).
- Why it's important: Unveils the temporal dynamics classic RFM misses. It helps distinguish tenants with consistent, habitual usage from those with erratic, bursty, or fading patterns – powerful indicators of engagement health.
How It Works (The Bird's-Eye View)
Calculating the features for this extended framework involves processing daily activity logs and tenant metadata. It aims to capture not just static snapshots but also the dynamics of engagement, placing particular emphasis on understanding the nature of recent activity. Here’s a concise overview:
-
Foundation Metrics & Signals:
- Criteria define Significant Activity based on meaningful usage thresholds (e.g., exceeding call counts), yielding a daily flag.
- Key Feature Categories (e.g., 'Communication', 'Automation') are defined, tracking daily usage via flags.
- Composite daily signals are engineered: a monetary proxy signal (weighted sum of valuable actions) and a primary engagement signal (sum of key volume metrics like total minutes) for pattern analysis.
-
Aggregation & Base RFM-T-U Calculation:
- Group daily data by tenant.
- Recency (R): Calculated from the last significant activity date.
- Frequency (F): Measures consistency of significant activity and recent average intensity (using the monetary proxy signal over a defined recent window, e.g., last 30 days).
- Monetary Proxy (M): Aggregates the historical monetary proxy signal and counts key events like recharges.
- Tenure (T): Calculated from the tenant's creation date via metadata.
- User Activity (U): Aggregates recent average and maximum daily active user counts.
-
Engagement (E) - Breadth & Depth Calculation:
- Breadth (B): Quantifies the diversity of feature categories used within the recent window.
- Depth (D): Measures the average intensity of usage for specific core features during their active days within the recent window.
-
Engagement (E) - Pattern (P) via Dual-Window Wavelet Analysis:
- The Challenge: How do we characterize the nature of engagement around the time of the last activity (Recency)? Is the tenant fading out with low energy, or were they highly active and regular right before?
- Why Wavelets? Continuous Wavelet Transform (CWT) is ideal because it analyzes a time series across different frequencies (or periods, like daily/weekly cycles) locally in time. A single CWT on the full history does contain information about the recent past.
- Why Two Analyses (Historical vs. Recent)? While one CWT gives coefficients for all time, analyzing the recent period in isolation provides unique context. We perform two separate analyses:
- Historical Analysis: Analyzes the entire engagement signal history. The signal is standardized based on the historical mean and standard deviation. Features derived (
EP_Historical_...) describe long-term patterns relative to the tenant's overall average behavior. - Recent Window Analysis: Analyzes only the engagement signal from the defined recent window (e.g., last 30 days). Crucially, this segment is standardized based on the mean and standard deviation of that recent window only. Features derived (
EP_Recent_...) describe the pattern characteristics intrinsic to that recent period, independent of potentially different historical norms.
- Historical Analysis: Analyzes the entire engagement signal history. The signal is standardized based on the historical mean and standard deviation. Features derived (
- Rationale for Separation: By standardizing the recent window separately, the
EP_Recent_...features (Power, Period, Entropy) act as a direct qualifier for Recency. They describe the energy, rhythm, and regularity of the engagement phase leading up to the present, relative to the behavior within that phase. This helps distinguish a tenant who was recently active but winding down (low recent power/entropy) from one who was recently active and highly engaged (high recent power/low entropy). The historical analysis provides the long-term baseline for comparison. - Feature Extraction: From both CWT outputs (Historical and Recent), we extract:
- Spectral Power: Total energy of fluctuations (high power = high variance/activity level relative to the period's baseline).
- Peak Period: Dominant cycle length (days) within the period.
- Spectral Entropy: Pattern regularity (lower = more predictable/regular cycles within the period).
This approach uses the power of CWT to understand patterns over time, but applies it strategically to both long-term history and the critical recent window. The separate analysis of the recent period, particularly its unique standardization, yields features that directly characterize the nature and intensity of engagement relevant to the Recency score.
The Payoff: Why Adopt This Framework?
Moving beyond basic RFM to a framework like RFM-T-U-E(BDP) offers tangible benefits:
- More Accurate Segmentation: Group tenants based on truly meaningful behavioural differences.
- Improved Churn Prediction: Richer features lead to more accurate models identifying at-risk tenants.
- Better Health Scoring: Develop a holistic view of tenant engagement and value.
- Actionable Insights: Pinpoint why a tenant might be disengaged (e.g., low breadth, irregular pattern, declining depth) to guide Customer Success interventions.
- Identify Opportunities: Spot highly engaged power users or tenants ripe for upsell based on deep or broad usage.
- Context-Specific: Designed for the realities of SaaS data.
Thinking About Your Data
While this framework was developed for our specific needs, the underlying principles are broadly applicable. Ask yourself:
- What constitutes "significant" activity for your platform?
- What are your key value-driving features (for Depth)?
- How diverse is feature usage across your tenants (for Breadth)?
- Do you have reliable daily user counts?
- Could understanding the pattern of usage unlock new insights?
Moving Forward
Classic RFM is a starting point, but SaaS demands more. By incorporating Tenure, User Activity, and a multi-faceted view of Engagement including Breadth, Depth, and Pattern dynamics, the RFM-T-U-E(BDP) framework provides a far richer, more actionable understanding of tenant behavior. It empowers data-driven decisions to boost engagement, reduce churn, and ultimately grow your business.
We're excited about the potential of this framework and hope it inspires you to think critically about how you measure tenant engagement.

